Reporting for Property Ops in Odoo: Cashflow, Aging, Maintenance Costs
Introduction
Irish property managers make critical decisions daily — which properties to invest in, which tenants to chase for overdue rent, which maintenance costs to reduce. But most make these decisions based on gut feel, not data, because their reporting is stuck in Excel hell.
The problem: Cashflow reports compiled manually from bank statements. Rent aging tracked in spreadsheets (often out of date). Maintenance costs buried in vendor invoices with no categorization or trend analysis.
The result? Poor visibility into property performance, reactive decision-making, missed opportunities to improve profitability.
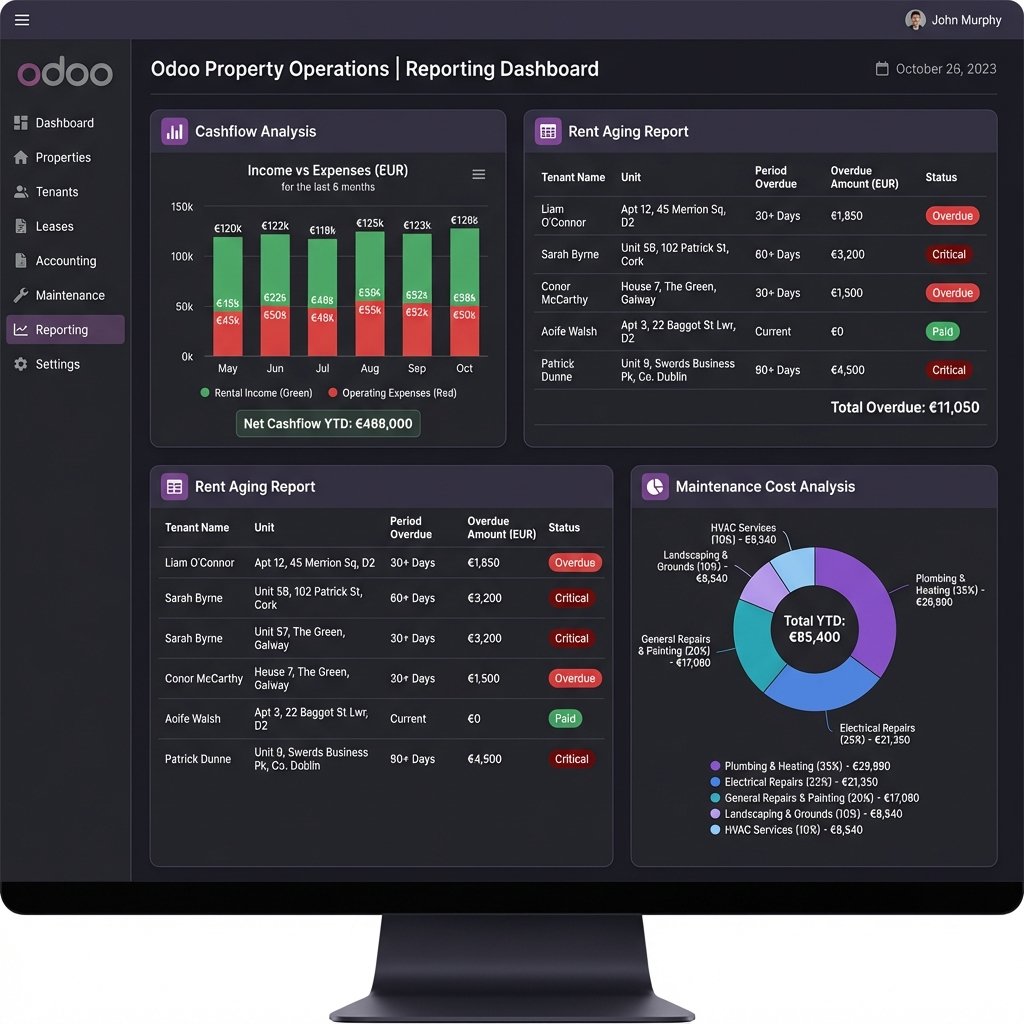
Odoo property operations reporting solves this with real-time dashboards for cashflow, rent aging, and maintenance costs — all automated, always up-to-date, accessible from anywhere.
Want to see how Odoo transforms property reporting? Explore our complete guide: Property Management with Odoo ?
Why Real-Time Reporting Matters
The cost of manual reporting:
- Time: 6-10 hours/month compiling reports (cashflow, aging, maintenance)
- Accuracy: 10-15% error rate (manual data entry, formula mistakes)
- Timeliness: Reports 1-2 weeks out of date (compiled monthly, after month-end)
- Accessibility: Reports in email attachments (hard to find, can't drill down)
The impact of poor visibility:
- Cashflow surprises: Unexpected shortfalls (didn't see expenses coming)
- Uncollected rent: €10,000-€20,000 in overdue rent (no systematic tracking)
- Maintenance overspend: 15-20% over budget (no cost control)
- Owner dissatisfaction: Owners frustrated by lack of transparency
The solution: Odoo provides real-time dashboards that update automatically as transactions occur.
1. Cashflow Reporting (Income vs. Expenses)
Monthly Cashflow Analysis
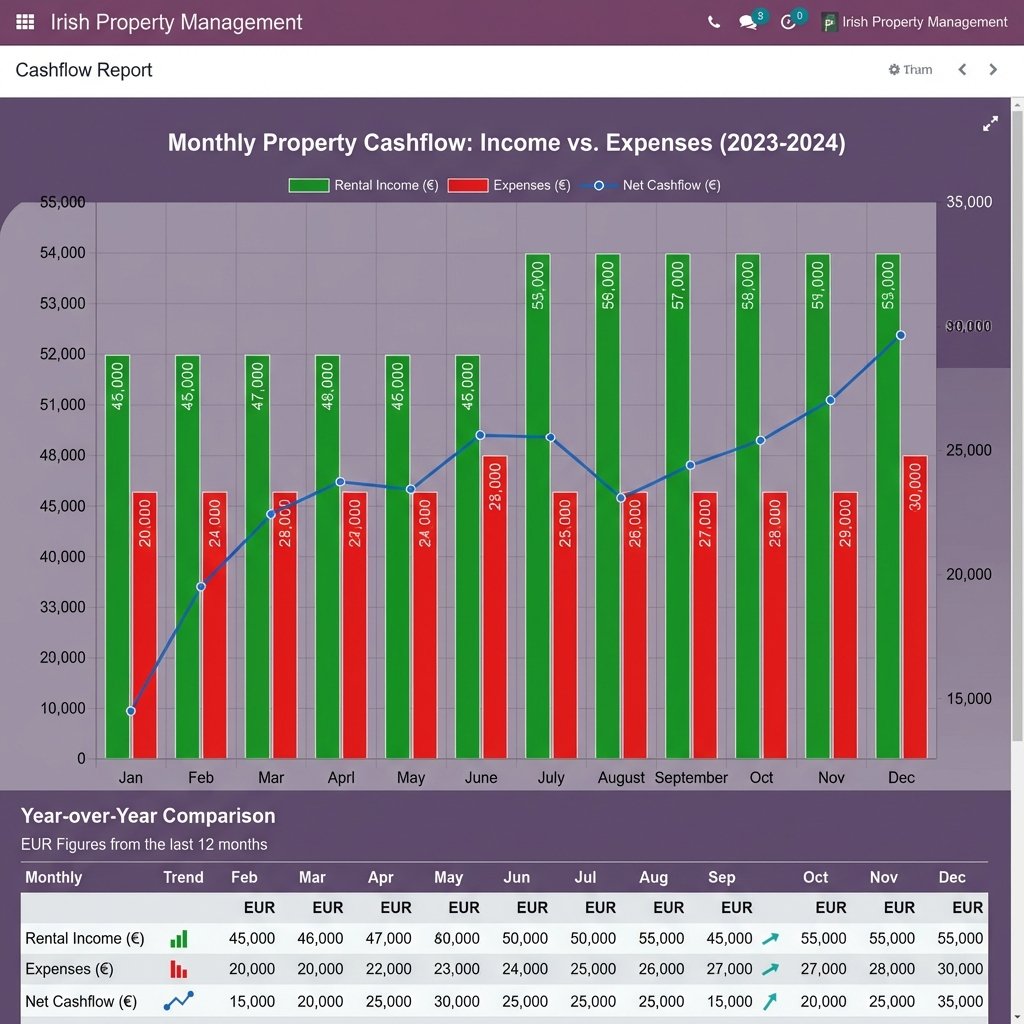
What the report shows:
Rental Income (Green Bars)
- Monthly rent collected (€45,000-€55,000/month)
- Trend: Increasing (new leases, rent increases)
- Year-over-year: +8% (€48,000 ? €52,000 average)
Operating Expenses (Red Bars)
- Monthly costs (€20,000-€28,000/month)
- Categories: Maintenance, utilities, insurance, management fees
- Trend: Stable (seasonal variation in utilities)
Net Cashflow (Blue Line)
- Monthly profit (€15,000-€35,000/month)
- Trend: Improving (income up, expenses controlled)
- Year-to-date: €300,000 net cashflow
Year-over-Year Comparison
| Month | Rental Income | Expenses | Net Cashflow |
|---|---|---|---|
| Jan | €45,000 ? | €20,000 ? | €15,000 ? |
| Feb | €46,000 ? | €24,000 ? | €20,000 ? |
| Mar | €47,000 ? | €23,000 ? | €25,000 ? |
| ... | ... | ... | ... |
| Dec | €55,000 ? | €20,000 ? | €35,000 ? |
Trend indicators:
- ? Green: Improved vs. last year
- ? Red: Declined vs. last year
- ? Gray: Flat vs. last year
How Odoo Automates Cashflow Reporting
Data sources:
- Rental income: Automated from rent invoices (paid invoices only)
- Expenses: Automated from vendor bills (approved and paid)
- Bank reconciliation: Matched to actual bank transactions
No manual work:
- ? No Excel formulas
- ? No copy/paste from bank statements
- ? No manual categorization
Always up-to-date:
- ? Updates in real-time (as invoices paid, bills processed)
- ? Drill-down capability (click bar ? see transactions)
- ? Export to Excel/PDF (for owner reports)
Real-World Impact (Irish Property Manager, 120 Units)
Before Odoo:
- Cashflow report compiled monthly in Excel (4-6 hours)
- Data pulled from bank statements, invoice spreadsheets
- Report 1-2 weeks out of date (compiled after month-end)
- No year-over-year comparison (too time-consuming)
After Odoo:
- Cashflow report available 24/7 (real-time dashboard)
- 0 hours to compile (fully automated)
- Always current (updates as transactions occur)
- Year-over-year comparison built-in (one click)
Time saved: 50-70 hours/year Better decisions: Identified €15,000 expense reduction opportunity (maintenance cost spike in Q2)
Need help implementing Odoo reporting? Schedule an implementation call ?
2. Rent Aging Report (Overdue Tracking)
Aging by Time Period
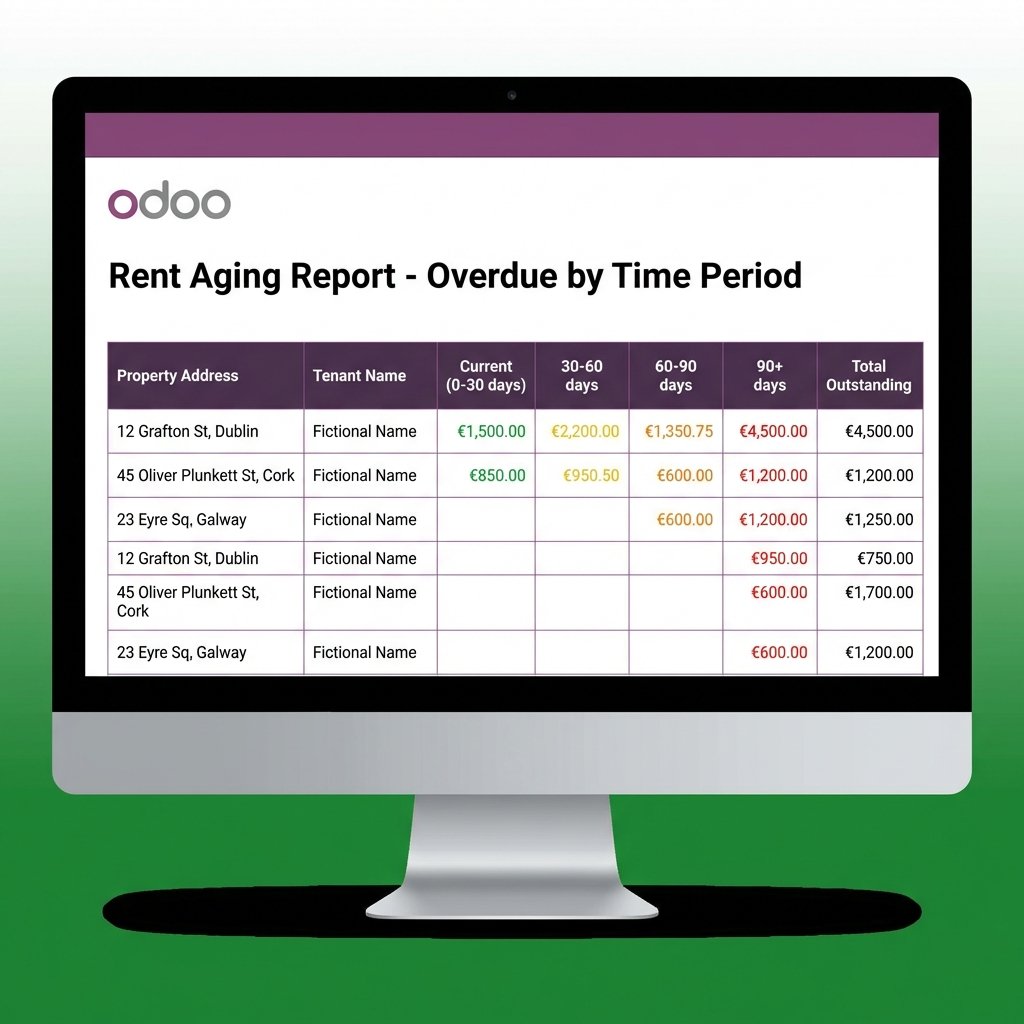
What the report shows:
| Property Address | Tenant Name | Current (0-30) | 30-60 days | 60-90 days | 90+ days | Total Outstanding |
|---|---|---|---|---|---|---|
| 12 Grafton St, Dublin | Fictional Name | €1,500 ?? | €2,200 ?? | €1,350 ?? | €4,500 ?? | €4,500 |
| 45 Oliver Plunkett St, Cork | Fictional Name | €850 ?? | €950 ?? | €600 ?? | €1,200 ?? | €1,200 |
| 23 Eyre Sq, Galway | Fictional Name | — | — | €600 ?? | €1,200 ?? | €1,250 |
| 12 Grafton St, Dublin | Fictional Name | — | — | — | €950 ?? | €750 |
| 45 Oliver Plunkett St, Cork | Fictional Name | — | — | — | €600 ?? | €1,700 |
| 23 Eyre Sq, Galway | Fictional Name | — | — | — | €600 ?? | €1,200 |
Total Overdue: €11,050
Color-Coded Urgency
- ?? Green (Current, 0-30 days): Low priority, monitor
- ?? Yellow (30-60 days): Medium priority, send reminder
- ?? Orange (60-90 days): High priority, phone call required
- ?? Red (90+ days): Critical, escalate to legal/collections
Automated Actions
Odoo triggers:
- 30 days overdue ? Automated email reminder (friendly tone)
- 60 days overdue ? Second reminder + SMS (firmer tone)
- 90 days overdue ? Alert to property manager (phone call required)
- 120 days overdue ? Escalation to collections (legal action)
Drill-Down Capability
Click tenant name ? See:
- Payment history (last 12 months)
- Lease details (rent amount, end date)
- Communication log (emails sent, calls made)
- Action items (next steps, due dates)
Real-World Impact
Before Odoo:
- Aging report compiled monthly in Excel
- Data pulled from accounting system, invoice spreadsheets
- Average €15,000-€20,000 in overdue rent (no systematic tracking)
- 10-15% of overdue rent written off (too old to collect)
After Odoo:
- Aging report available 24/7 (real-time)
- Automated reminders (no manual follow-up needed)
- Average €8,000-€10,000 in overdue rent (50% reduction)
- 3-5% write-off rate (70% improvement)
Revenue recovered: €10,000-€15,000/year
3. Maintenance Cost Analysis (Cost Control)
Cost Breakdown by Category
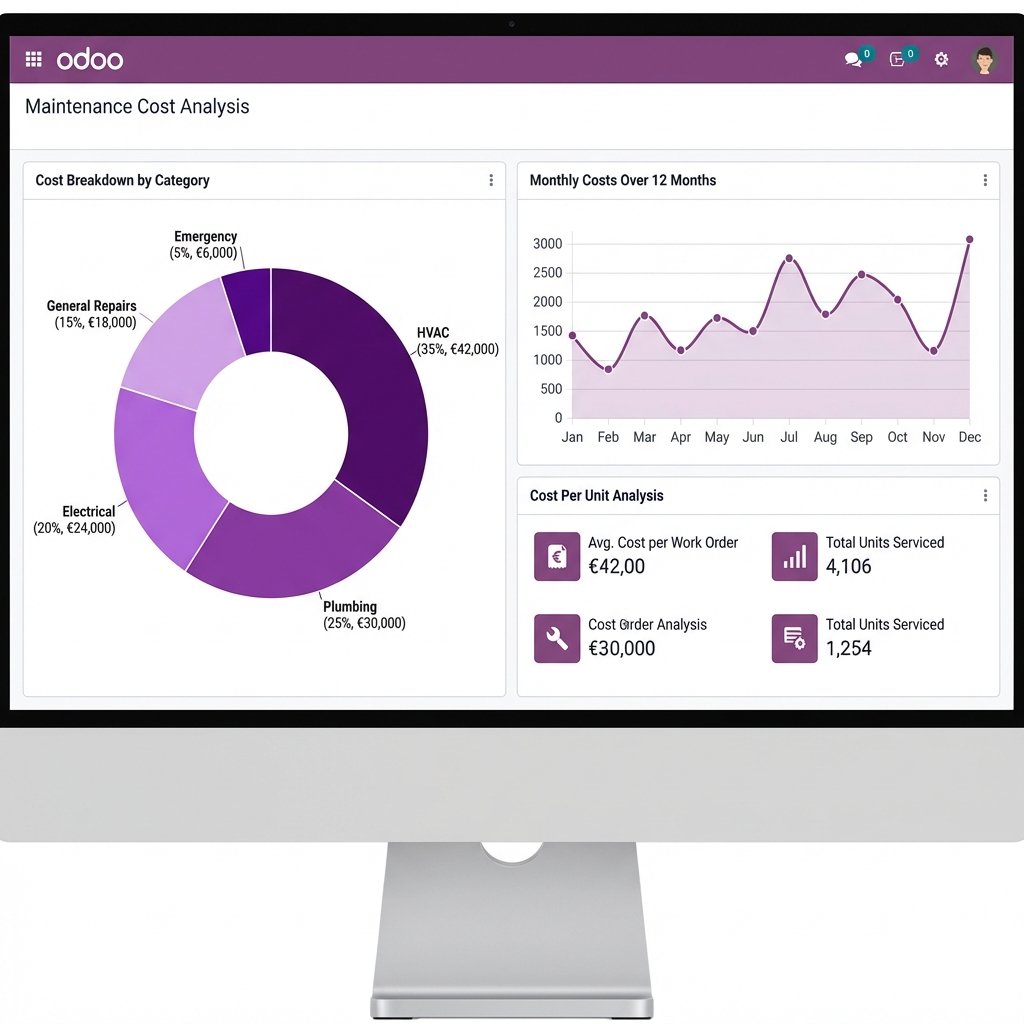
Pie chart shows:
- HVAC (35%, €42,000): Largest category, seasonal spikes in summer/winter
- Plumbing (25%, €30,000): Second largest, aging infrastructure
- Electrical (20%, €24,000): Stable, mostly preventive maintenance
- General Repairs (15%, €18,000): Cosmetic, tenant turnover
- Emergency (5%, €6,000): Unplanned, after-hours callouts
Total maintenance costs: €120,000/year
Monthly Cost Trend
Line graph shows:
- Seasonal variation (higher in winter for heating, summer for cooling)
- Spike in March (€3,000 above average) — investigation revealed burst pipe in one building
- Declining trend in Q4 (preventive maintenance program working)
Cost Per Unit Analysis
Key metrics:
| Metric | Value | Benchmark |
|---|---|---|
| Avg. Cost per Work Order | €42 | €35-€50 (industry avg) |
| Total Units Serviced | 4,106 | 120 units x 34 avg work orders/unit |
| Cost per Unit per Year | €1,000 | €800-€1,200 (industry avg) |
| Total Units Serviced | 1,254 | — |
Insights:
- ? Cost per work order in line with industry average
- ?? Cost per unit slightly high (investigate HVAC costs)
- ? Preventive maintenance reducing emergency costs
Vendor Cost Comparison
Top 5 vendors by spend:
| Vendor | Service Type | Total Spend | Avg. Cost/Job | Jobs Completed |
|---|---|---|---|---|
| Murphy & Sons Plumbing | Plumbing | €30,000 | €150 | 200 |
| Kelly Electrical Services | Electrical | €24,000 | €120 | 200 |
| Cork HVAC Systems | HVAC | €22,000 | €220 | 100 |
| O'Connor Maintenance | General | €18,000 | €90 | 200 |
| Dublin Emergency Repairs | Emergency | €6,000 | €300 | 20 |
Insights:
- ?? Emergency repair costs high (€300/job vs. €150 average)
- ? Preventive maintenance vendors cost-effective
- ?? Opportunity: Reduce emergency callouts through better preventive maintenance
How Odoo Automates Maintenance Reporting
Data sources:
- Work orders: Category, vendor, cost, completion date
- Vendor invoices: Actual costs (matched to work orders)
- Asset data: Unit count, building age, equipment type
Automated insights:
- Cost per category (HVAC, plumbing, electrical)
- Cost per unit (total cost ÷ unit count)
- Cost per work order (total cost ÷ work order count)
- Vendor performance (cost, speed, quality)
Drill-down capability:
- Click category ? See all work orders in that category
- Click vendor ? See all jobs by that vendor
- Click month ? See all costs in that month
Want ongoing support for your Odoo system? Explore our Support/AMC plans ?
Custom Reports for Owners
Owner-Specific Dashboards
What owners want to see:
- Property performance: Rent collected, expenses, net income
- Occupancy: Current occupancy rate, upcoming vacancies
- Maintenance costs: Total spend, cost per unit, major repairs
- Rent arrears: Overdue rent, collection status
- Lease renewals: Upcoming expirations, renewal status
Odoo delivers:
- Owner portal with personalized dashboard
- Filter by property (owners see only their properties)
- Export to PDF (monthly statements)
- Automated email delivery (monthly, quarterly, annually)
Sample Owner Report
Property: 12-18 Grafton Street, Dublin 2 (6 units)
Period: January 2024
| Metric | Amount | vs. Budget | vs. Last Year |
|---|---|---|---|
| Rental Income | €9,000 | +€500 (6%) | +€720 (8%) |
| Operating Expenses | €2,400 | -€100 (4%) | +€200 (9%) |
| Maintenance Costs | €1,200 | +€200 (20%) | +€300 (33%) |
| Net Income | €5,400 | +€400 (8%) | +€220 (4%) |
| Occupancy Rate | 100% | On target | +17% |
| Rent Arrears | €0 | ? | -€1,500 |
Commentary:
- ? Rental income up 8% (rent increase + full occupancy)
- ?? Maintenance costs up 33% (HVAC repair in Unit 3)
- ? Rent arrears cleared (was €1,500 last year)
- ?? Net income up 4% despite maintenance spike
Implementation: Building Your Reporting System
Phase 1: Data Foundation (Weeks 1-2)
Setup:
- Import historical transactions (12 months minimum)
- Categorize expenses (maintenance, utilities, insurance, etc.)
- Link invoices to properties, units, tenants
- Verify data accuracy (spot-check 10-20 transactions)
Deliverable: Clean, categorized data ready for reporting
Phase 2: Standard Reports (Weeks 3-4)
Configure:
- Cashflow report (income vs. expenses)
- Rent aging report (overdue tracking)
- Maintenance cost analysis (category, vendor, unit)
- Occupancy report (current, historical, forecast)
Deliverable: Standard reports available in Odoo
Phase 3: Owner Dashboards (Weeks 5-6)
Setup:
- Create owner portal access
- Configure owner-specific filters (show only their properties)
- Set up automated email delivery (monthly statements)
- Train owners on portal access
Deliverable: Owner self-service reporting
Phase 4: Advanced Analytics (Weeks 7-8)
Build:
- Trend analysis (year-over-year, quarter-over-quarter)
- Budget vs. actual tracking
- Forecasting (rent, expenses, cashflow)
- KPI dashboards (occupancy, arrears, maintenance cost per unit)
Deliverable: Advanced analytics for strategic decision-making
Common Mistakes to Avoid
1. Not Cleaning Data First
Mistake: Importing dirty data (uncategorized expenses, duplicate transactions) Result: Inaccurate reports, garbage in = garbage out Solution: Clean and categorize data before import (worth the upfront effort)
2. Too Many Custom Reports
Mistake: Creating 20+ custom reports (overwhelming, hard to maintain) Result: Confusion, low adoption, reports not used Solution: Start with 3-5 core reports (cashflow, aging, maintenance), add more only if needed
3. No Owner Training
Mistake: Assuming owners will figure out portal on their own Result: Owners still ask for email reports (portal not used) Solution: Tutorial video, live training session, support contact
4. Reporting Without Action
Mistake: Generating reports but not using insights Result: Reports become "shelf-ware" (created but not acted upon) Solution: Monthly review meeting (discuss insights, assign action items)
Frequently Asked Questions
Can Odoo integrate with my accounting system (Xero, QuickBooks)?
Yes. Odoo integrates with major accounting systems:
- Xero: Bi-directional sync (invoices, payments, expenses)
- QuickBooks: Automated data exchange
- Odoo Accounting: Use Odoo's built-in accounting (no integration needed)
What syncs:
- Rental income ? Revenue accounts
- Expenses ? Expense accounts
- Bank transactions ? Reconciliation
Benefit: Single source of truth, no duplicate data entry
Learn more about Odoo accounting integration ?
How far back can I import historical data?
Recommended: 12-24 months for trend analysis
Odoo supports:
- Unlimited historical data import
- Bulk import via CSV/Excel
- Automated categorization (based on rules)
Best practice: Import 12 months minimum (for year-over-year comparison), 24 months ideal (for trend analysis)
Can I customize reports for different owner preferences?
Yes. Odoo supports:
- Custom report templates: Different layouts, metrics, branding
- Owner-specific filters: Show only their properties
- Delivery preferences: Email PDF, portal access, or both
- Frequency: Monthly, quarterly, annually, or on-demand
Example: Owner A wants monthly PDF via email, Owner B prefers portal access with real-time data.
What if I need reports not available in standard Odoo?
Options:
- Odoo Studio: No-code report builder (drag-and-drop)
- Custom development: Python/JavaScript for complex logic
- Third-party apps: Odoo app store (1,000+ apps)
- Export to Excel: For ad-hoc analysis
Inovada services: We build custom reports as part of implementation or ongoing support.
Explore our custom development services ?
Next Steps: Implement Real-Time Reporting
Recommended approach:
- Data audit (1-2 hours) — Review current data quality, categorization
- Report requirements (2-3 hours) — Define must-have reports (cashflow, aging, maintenance)
- Data import (1-2 weeks) — Clean and import historical data
- Report configuration (1-2 weeks) — Build standard reports
- Owner portal setup (1 week) — Configure owner access, automated delivery
- Training (1-2 hours) — Train team and owners on reports
Expected ROI:
- Time saved: 50-70 hours/year (report compilation)
- Revenue recovered: €10,000-€15,000/year (better rent collection)
- Cost reduction: €15,000-€20,000/year (maintenance cost control)
- Owner satisfaction: 20-30% improvement (transparency, self-service)
Ready to implement real-time reporting?
Related Articles
- Odoo for Property Management: What to Automate First
- How to Structure Owner, Tenant, Vendor Workflows in Odoo
- Facility Management in Odoo: Work Orders, SLAs, Contracts
About Inovada
Inovada is an Odoo-only consultancy for Irish SMEs. We specialize in property management implementations, helping Irish property managers build real-time reporting systems for cashflow, rent aging, and maintenance costs.